
Store Manager is a development to cover needs of Managers Stores in order to improve customer service and sales.

Project Date: January 2020 Platform Web: Development My Role: UX Designer UI Designer Design Tools: XD, Illustrator, Pen & Paper Deliverables UX:Finding Interviews, Scenarios, User Journey, Site Map, User Flow, Persona, Usability Testing, Wireframes, Prototype Low & Hight Fidelity
Overview
Walmart has over 5,500 stores in the US with over 1.2 million U.S. store workers. Each store has a store manager who manages operations of his/her store. Store managers are usually on rounds and carry iPad Pro (10.5). Each store manager is responsible for ensuring their stores have a high CFF score compared to other Walmart stores in that area.
What I did?
- Stakeholder interviews
- User Interviews
- Setting goals and objectives
- Persona
- Scenarios
- User journey
- Site map
- Creating wireframes
- usability testing
- Competitive Analysis
- Low-fidelity Prototypes
- High fidelity prototypes
Discovery Research
In order to understand what problem we are solving, I conducted 4 interviews with Managers store. Here are the findings to understand what the problem They are facing
Findings
User need is based on Key responsibilities of a store manager:
1. Managing store income - $ value generated by sales done in a store
2. Meet monthly store score goal
3. Review store performance compared to neighbouring stores
4. View customer feedback/reviews for store
5. View and manage store associate schedules
6. View and manage promotional events in store
Empathy Users and Extreme Users

Interview Questions
- 1. What’s your activities during the day?
- 2. Which of those activities, make you feel frustrated because you can not handle as you wish?
- 3. What is the device that you use frequency?
- 4. What kind of digital format or on paper currently you use to admin the store?
- 5. How long spend to review the reports?
- 6. What is your score more important?
- 7. Which are the whole scores that you need to be aware of?
- 8. What are your main frustrations to manage the store day by day?
- 9. How you realize the customer service in your store is being good?
- 10. How do you feel at the end day?
- 11. What is the process you use to schedule employers every day?

Empathy map
Empathy map allows visualizing what we know about the User, this knowledge about users in order to create a shared understanding of user needs and aid in decision making. this map split into 4 quadrants (Says, Thinks, Does, and feels), Empathy map provides a glance into a user is as a whole and the information is not chronological or sequential.

Affinity Diagram
Managing store income $ value generated by sales done in a store
Meet monthly store score goal
Review store perfomance compared to neighborhood stores
View customer feedback / reviews for store
View and manage store associate schedules
iPad device is the best
Synthesis
Having our research and information I synthesized information Creating persona in order to know the person who is going to use our product and next to the team we start to write the ideas we consider should have our development.
Persona
Persona are fictional characters, which was created based on research in order to represent the user. Persona help to understand User needs, experiences, behavior and goals.

Ideation: Converge
This step allows converge ideas, focus on the task at hand without distractions, interpret or analyze information at their own pace, generate creative ideas in a safe space, besides identify patterns, cover new perspectives, and increase the odds of solving the problem of finding objective truth.
Profile Profile and account in order to Receive message, Receive notifications
Store Reviews See google review summary, Feedback stores and reviews, See name and comments about my store
Dashboard Search stores, Manage store Log in, See a Dashboard, Details of my store, Administration of users, My Ranking and details respect to others around my neighborhood
Sales report Sales by Delivery, Neighborhood map, Sales in store, Sales pick-up, Report on all products sold by the day, Monthly Statistics, Compare by store against my store
Comparative filters Filter, Yearly, monthly and weekly comparison and monthly statistics
Events See the event in my store, Detail event, schedule, campaign, name of the promotion Add events
Schedule Employees schedule by day, week, and day, Be able to select position job, Be able to select the range schedule, Have details of employee, location, mobile, Admin employee
Design
Having synthesis I could start to translate our research on flows, screens, structure, visuals, and prototypes.
Site Map
I created a site map that helps to plan out our website. Contain all the pages and shows how the user access and include all the subpages.

Information Architecture
Information Architecture defines how content will be structured and presented to a user when they are interacting with our design.

User Flows
I created a user flows that takes them from their entry point through a set of steps to a successful outcome and final action.
After creating the information architecture, I built user flows to get a better understanding of how Store Managers will take to achieve their goals. Those are four key user flow: Sign Up/Login, Dashboard, Comparative Sales, Manage event store, Review Schedule & reviews store and comments.


Sketch
With a paper prototype, I could test early design ideas at extremely low cost. I fixed problems before to start the wireframe process. This is the first approach to the problem that allowed me to change and define the user interface architecture.
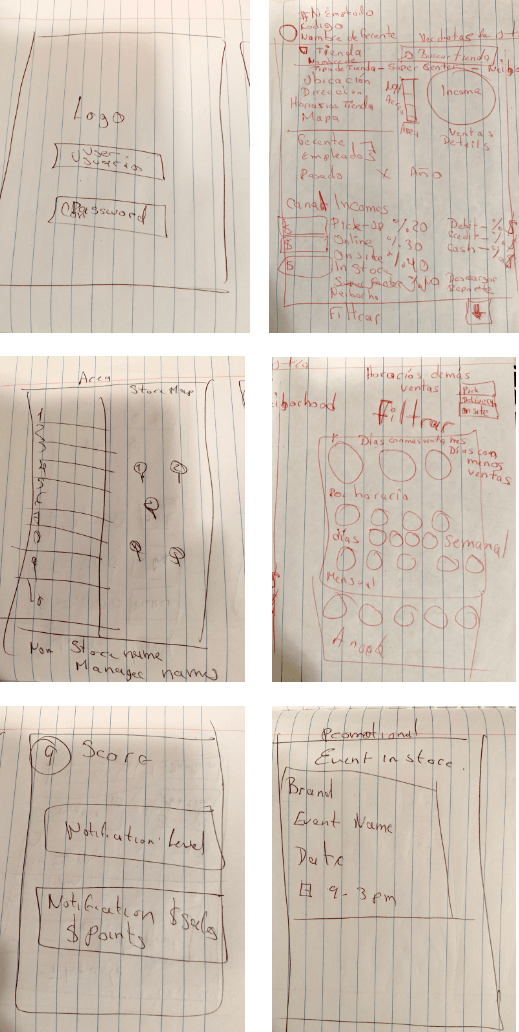

Wireframes
Wireframing as low-fidelity prototyping allowed rapid iterative in order to usability test and get insight early and get problems early.


Testing Findings
- In this first approach, users suggested being able to compare by periods of time against others and to be able to compare the sales of different store and the same store in comparison another year, month, or day
- Users want to be able to change to add events and manage them, also they need to have a picture in order to identify them
- Users do not have more than 8 cashiers, it is better to have two columns instead of 3 besides they would like to see photos from people
- Users want to have an account to see message and notification when they are inside of a store
Mockup High Fidelity
High fidelity prototype is an integral part of the design process, It allows us to turn a vision into something tangible in order to test our hypothesis with real users. Also allows experimenting and explore various approaches to an idea before selecting the one that is most valuable both from a business and user standpoint. The goal is to ensure that their product satisfies the user's needs. Prototyping allows us to explore and validate ideas before investing too many resources.


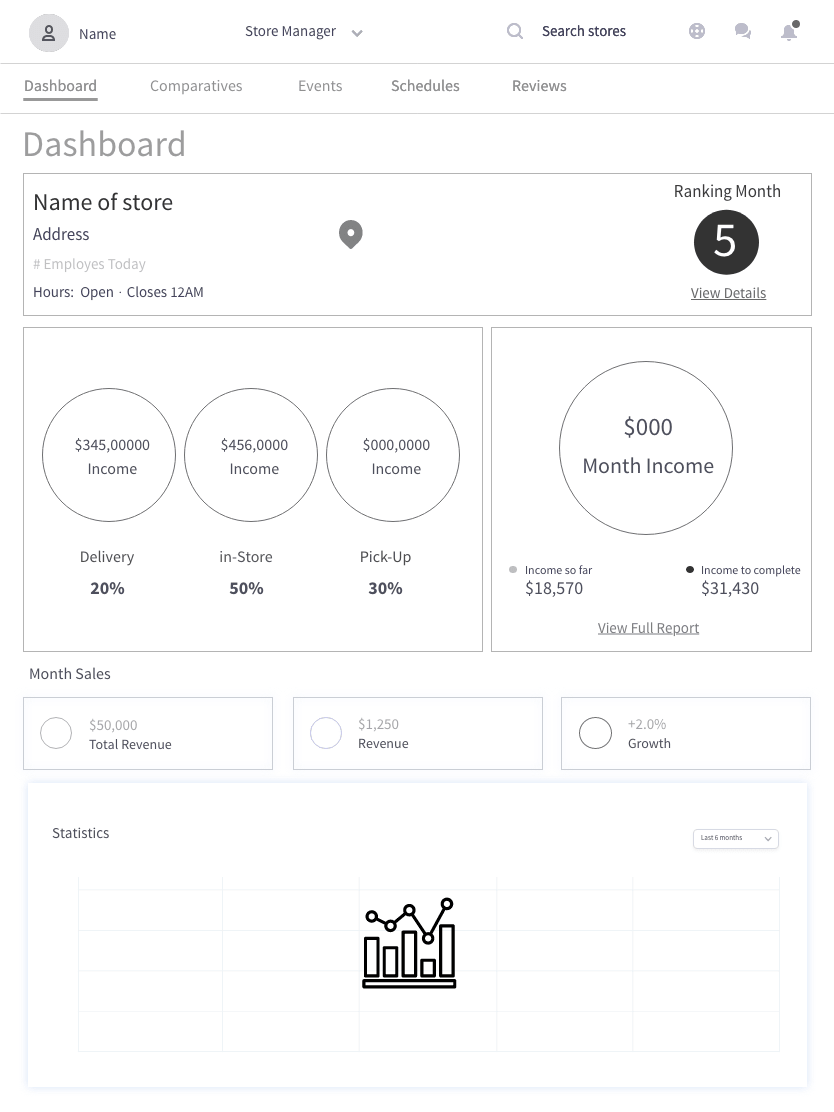
On the login screen, the user can click on the login button to access the application.
On the dashboard screen, the user can view his name, photo, a store search engine. If you click on the bell icon a notification window is displayed
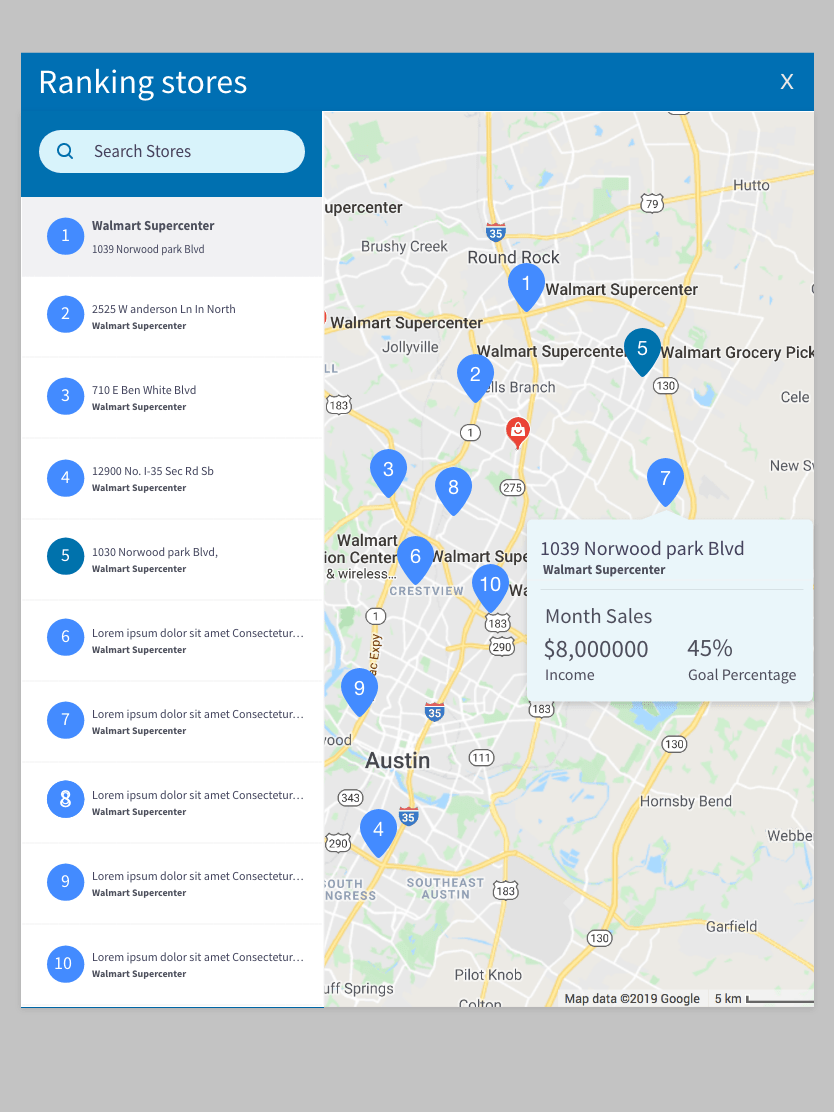
On the dashboard screen, the user will be able to visualize the month ranking and by clicking on view details a window will be displayed with the details of the rankings of the other stores and detail in information.
On the dashboard screen, you can view the total Month Income, the purchase channels and their percentages. Total revenue, revenue and growth, as well as analytics.
On the dashboard screen by clicking on comparatives, events, schedules and reviews you can navigate between the sections.
In the comparatives section the user click on in my store or by store to see a comparison of your sales with another store or a comparison over a period of time in your own store
In the events section, the user can view the events of your store and see a month filter.
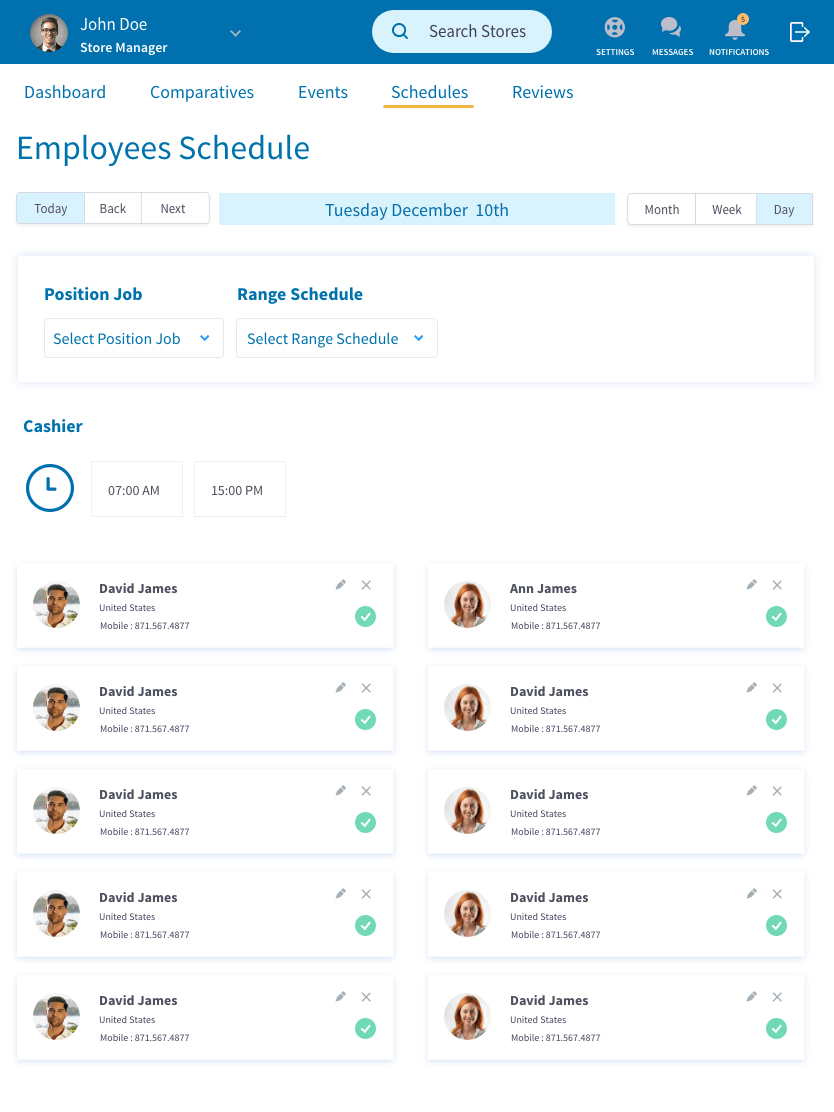
In the schedules section, the user can view the information of the employees, their position, their schedule and filters of month, week and day
In the Reviews section, the user will be able to see the comments that consumers write about their store